Most performance reports put Time to First Byte near the top of the list, usually with a number in milliseconds and very little explanation. That number matters, but it is often misread. Some people treat it as a measure of how fast their server is. Others treat it as a measure of network distance. It is really a combination of both, plus a few things that have nothing to do with either.
Understanding what TTFB actually contains makes it far more useful as a diagnostic signal, and it tells you where to look when a page feels slow before anything appears on screen.
What TTFB measures
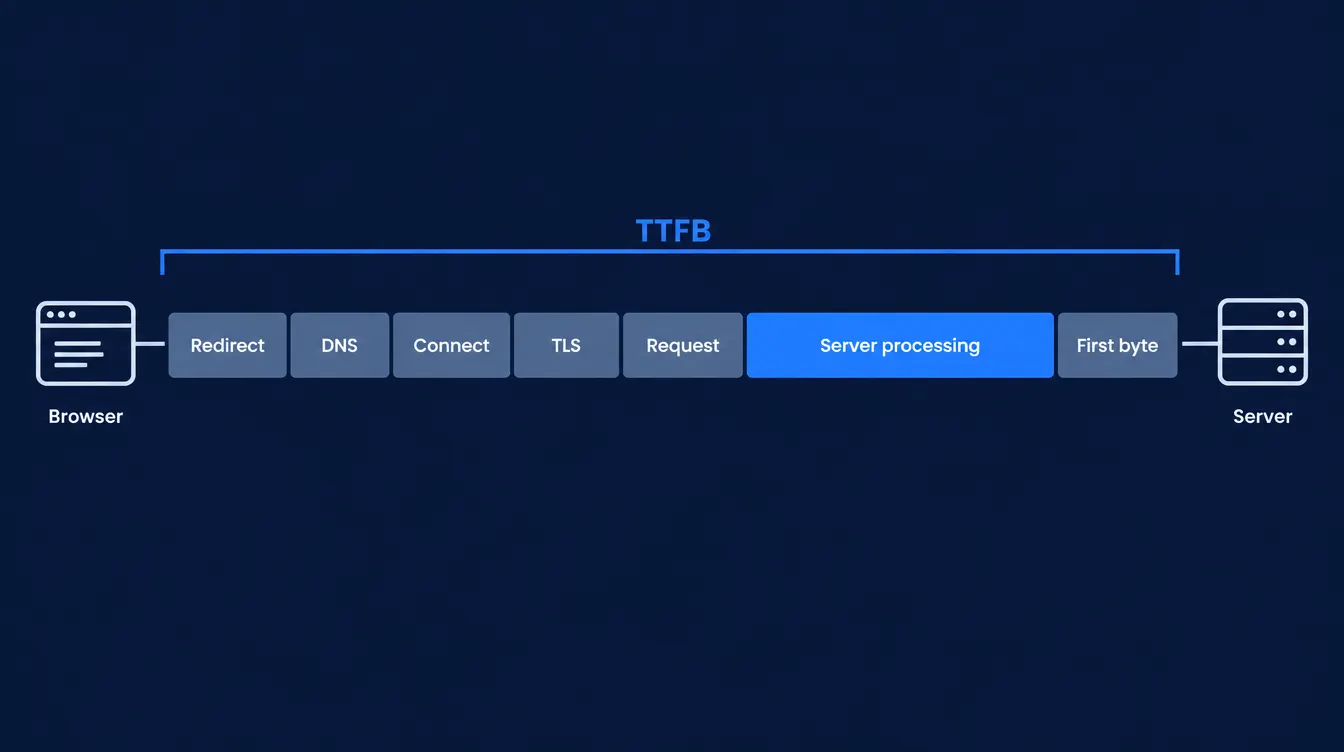
TTFB is the time between the moment the browser starts requesting a page and the moment the first byte of the server's response arrives back. It ends at the first byte, not the last one, and not at the point where anything becomes visible.
That single interval covers several separate stages:
- Redirects. If the requested URL returns a 301 or 302, the full cost of the redirect, including the DNS and connection work for the new destination, is counted.
- DNS lookup. Resolving the hostname to an IP address, assuming the answer is not already cached.
- Connection setup. The TCP handshake, or the QUIC equivalent on HTTP/3.
- TLS negotiation. Certificate exchange and key agreement on HTTPS connections.
- Request transmission. Sending the request across the network to the origin or the edge.
- Server processing. The time the application, database, and web server spend producing a response.
- First byte in transit. The response header travelling back to the browser.
A service worker, where one is installed, also adds its startup time to the measurement.
This is why two sites with an identical TTFB can have completely different problems. One might spend 600 ms waiting on a slow database query over a fast connection. The other might have a fast application but sit behind a redirect chain and a distant origin server. The summary number looks the same; the fix is not.
Why TTFB is not a pure network metric
It is common to see TTFB described as latency, which is misleading. Network latency contributes to it, but so does everything the server does before it starts writing a response.
The practical consequence is that you cannot decide between moving closer to your users and optimising the backend from the TTFB total alone. You need the breakdown. If DNS, connection, and TLS account for most of the interval, the problem is in the delivery path. If those stages are quick and there is still a long gap before the first byte, the problem is in the application.
This distinction also explains why a CDN does not automatically fix a high TTFB. A CDN shortens the distance for cached responses. For an uncached, dynamically generated page, the edge still has to reach back to the origin and wait for the application, and that wait remains in the measurement.
What counts as a good TTFB
Google's public guidance treats a TTFB at or below roughly 800 ms as good and anything above roughly 1.8 seconds as poor, with the range in between marked as needing improvement. Those thresholds are a reasonable starting reference rather than a target to chase in isolation.
TTFB is not itself a Core Web Vital. It is a supporting metric, and its main importance is that it acts as a floor for everything that follows. First Contentful Paint cannot happen before the first byte arrives, and Largest Contentful Paint cannot happen before that. A page with an 1,800 ms TTFB has already spent most of a typical LCP budget before the browser has parsed a single tag. Cutting that interval improves the downstream metrics automatically, which is why it is usually worth investigating before render-blocking resources or image sizing.
The reverse is not true. A low TTFB does not guarantee a fast page. A server can respond in 120 ms and still deliver a document that pulls in an oversized hero image, blocking scripts, and third-party tags that delay meaningful rendering by several seconds.
Common causes of a high TTFB
Application and database work
Uncached pages that run heavy queries, call external APIs synchronously, or build large responses on every request are the most frequent cause. CMS installations with many active plugins are a familiar example: each one adds work to the request cycle, and the total shows up before the first byte.
Missing or ineffective caching
If full-page caching is disabled, misconfigured, or bypassed by cookies and query parameters, every visit pays the full generation cost. Checking whether responses are actually being served from cache, rather than assuming they are, is often the fastest way to find a problem here.
Redirect chains
Each hop in a redirect chain adds a full round trip, and sometimes a fresh DNS lookup and TLS handshake. A chain from http:// to https://, then to www., then to a trailing-slash variant, can add several hundred milliseconds before the real page is even requested.
Connection and TLS overhead
On a first visit, handshake work is unavoidable, though it can be reduced. Session resumption, OCSP stapling, and HTTP/3 all shorten the setup phase. Connections that repeatedly renegotiate from scratch inflate TTFB for no benefit.
Geographic distance and routing
Distance costs round trips, and TTFB includes several of them. A request that crosses an ocean carries that cost at the DNS, connection, TLS, and request stages, compounding the effect. Routing quality matters as much as raw distance; traffic that takes an indirect path between regions can be slower than a longer but better-connected route.
Server resource contention
Shared hosting, saturated CPU, exhausted PHP worker pools, and slow disk I/O all delay the point at which the application can begin responding. This tends to show up as an unstable TTFB rather than a consistently high one, with the number climbing under load.
Measuring TTFB from more than one location
A single test from your own machine tells you what the site is like from your own network, at that moment, over your own connection. That is useful information, but it is not a picture of how the site behaves for the audience you actually have.
Testing from multiple regions is how you separate a server problem from a distribution problem. If TTFB is consistently high everywhere, including from a node close to your origin, the delay is almost certainly in the application. If it is low near the origin and climbs sharply in other regions, the delivery path is the more likely explanation.
Latixo runs each test in a real Chromium browser from Browser Nodes in Virginia, Seattle, Nuremberg, Tokyo, Singapore, São Paulo, and Beijing. The current production result reports TTFB alongside the HTTP status, the protocol negotiated for the main document, content type, total load time, request count, the node used, a final screenshot, and a replay of the loading process. Desktop and Mobile test profiles are selected separately, which matters because the two profiles apply different rendering conditions to the same response.
Important: the current Latixo production result does not break TTFB down into its DNS, connection, and TLS components, and does not expose response headers. Use browser developer tools or your server and CDN diagnostics when you need that level of detail alongside the regional comparison.
Two cautions are worth keeping in mind. A test from one node reflects conditions on one network path at one point in time; it does not describe every user in that country, and it does not describe every hour of the day. Repeating a test, rather than acting on a single run, guards against transient routing issues and cold caches producing a misleading result.
If your origin sits in one region and your audience does not, start from a node near the origin and then repeat the same test from a more distant region such as Tokyo, Japan. Keep the test profile constant between runs so the comparison reflects the region rather than the device profile.
Lab data and field data are not interchangeable
A synthetic test, whether run from a test platform or from a local browser, is lab data. It is controlled and repeatable, which is exactly what you want for comparing a change against a baseline, or for isolating a variable such as region or device profile.
Field data comes from real visitors on real devices and networks, collected through real-user monitoring or a dataset such as the Chrome User Experience Report. It reflects the distribution of your actual audience, including slow devices, congested mobile networks, and geographies you may not have thought to test.
The two answer different questions. Lab data tells you what happened under known conditions. Field data tells you what your users are experiencing across all conditions. When they disagree, the usual explanation is that the test conditions differ from the audience profile, not that one source is wrong. Use lab measurements to diagnose and verify, and field measurements to decide whether a problem is worth prioritising.
Reducing TTFB
The order of work follows the breakdown:
- Serve cacheable pages from cache, and confirm from the response headers that the cache is actually being hit.
- Remove redirect chains, and link internally to the final canonical URL rather than to a redirecting version.
- Profile the slowest server-side operations, particularly database queries and synchronous external calls, and cache or defer what does not need to run on every request.
- Make sure the origin has enough capacity for peak concurrency, and check whether TTFB degrades under load rather than only testing it when the site is quiet.
- Reduce connection setup cost through TLS session resumption and, where supported, HTTP/3.
- Move static and cacheable content closer to users through a CDN, while recognising that this does not shorten origin processing for uncached responses.
After each change, re-test from the same nodes and the same profile you used for the baseline. Comparing a Mobile test in one region against a Desktop test in another produces a difference that tells you nothing about the change itself.
What TTFB will not tell you
It will not tell you whether the page renders quickly, whether the layout shifts, whether images are appropriately sized, or whether a third-party script is blocking interaction. It says nothing about what happens after the first byte, which is where most of the visible experience is decided.
Treat it as the first question rather than the whole diagnosis. A high TTFB tells you that something before the response is expensive. A low one simply means the server is out of the way, and the rest of the loading process deserves the attention instead.