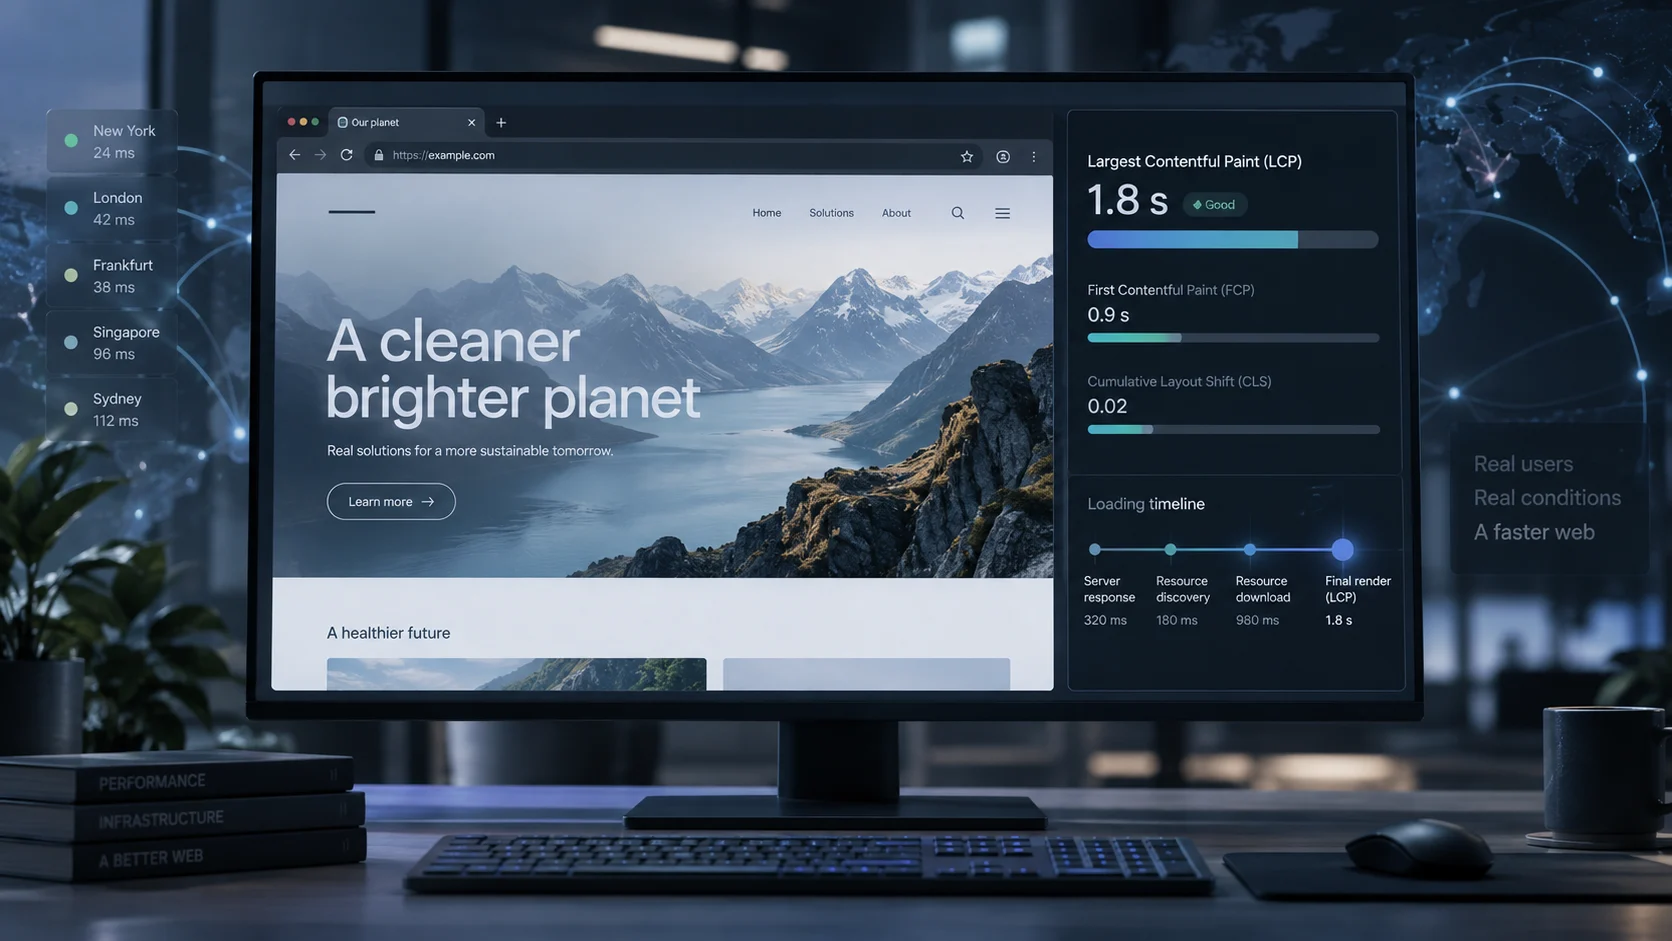
Largest Contentful Paint (LCP) is a Core Web Vitals metric that estimates when the main content of a page becomes visible to the user. It reports the time, measured from the start of the page load, at which the largest image, video, or text block in the viewport finishes rendering.
LCP focuses on a question users actually care about: when can I see what I came here for? Earlier metrics such as onload or DOMContentLoaded describe internal browser milestones, and they often have little to do with what appears on screen. First Contentful Paint (FCP) is closer, but it fires as soon as anything renders, even a logo or a loading spinner. LCP targets the moment the dominant piece of content appears, which usually corresponds to the page feeling loaded.
What LCP Measures
When a page starts loading, the browser keeps track of the largest content element rendered in the viewport so far. As new content appears, a larger element may replace the current candidate. The final LCP value is the render time of the last candidate reported before the browser stops tracking.
On a typical article page, the LCP element might be a hero image, the main heading, or the first paragraph of body text. On a product page, it is often the main product photo. On a landing page with a large headline and no hero image, a text block can be the LCP element.
The measurement is relative to when navigation began, so everything that happens before the element renders contributes to the final number: redirects, DNS lookup, connection setup, TLS negotiation, the server's response, downloading the resource, and the browser's rendering work.
What Counts as the Largest Contentful Element
Elements LCP considers
LCP does not evaluate every node on the page. The element types currently considered are:
<img>elements (for animated images, the first frame's presentation time is used)<image>elements inside an<svg><video>elements, using the poster image load time or the first frame's presentation time, whichever comes first- elements with a background image loaded through CSS
url()(CSS gradients do not count) - block-level elements containing text nodes or inline text children
The browser also applies heuristics to skip elements that are unlikely to be meaningful content. In Chromium-based browsers, elements with zero opacity are ignored, as are elements that cover the full viewport and are likely acting as a background. Low-information images, such as placeholders or very low-entropy images, may also be excluded.
How size is calculated
The size used for LCP is the element's visible area within the viewport. Parts of an element that extend off-screen, are clipped, or are hidden by overflow do not count. Margins, padding, and borders are not included.
For images, the browser uses the smaller of the visible size and the intrinsic size. An image scaled up beyond its natural dimensions therefore does not get credit for the extra area, while a large image displayed at a smaller size is counted at its displayed size.
When the browser stops reporting
Because pages load progressively, the LCP candidate can change several times. A heading might render first and be reported as the initial candidate, then a hero image loads and replaces it.
The browser stops reporting new candidates once the user interacts with the page through a tap, a scroll, or a key press. This matters in practice: content that renders after the first interaction will not become the LCP element, and the value recorded in field data depends partly on how quickly real users begin interacting.
What Is a Good LCP Score?
Google's current thresholds for LCP are:
| Rating | LCP |
|---|---|
| Good | 2.5 seconds or less |
| Needs improvement | More than 2.5 seconds, up to 4.0 seconds |
| Poor | More than 4.0 seconds |
For Core Web Vitals assessment, these thresholds are applied at the 75th percentile of page loads, segmented by mobile and desktop. A page is considered to have good LCP when at least 75% of measured visits are at 2.5 seconds or less. The percentile approach means a fast median is not enough if a significant share of users, often those on slower networks or devices, experience much longer load times.
Why LCP Matters
LCP is one of the three Core Web Vitals, alongside Interaction to Next Paint (INP) and Cumulative Layout Shift (CLS). Google says Core Web Vitals are used by its ranking systems as part of broader page experience, but good Core Web Vitals do not guarantee top rankings and relevance remains central. A strong LCP will not rescue a page that does not answer the search query, but improving a slow LCP can improve the loading experience for users.
The more direct reason to care is user behavior. When the main content takes several seconds to appear, visitors are more likely to leave before reading, scrolling, or converting. LCP gives teams a user-facing number that reflects perceived loading performance and can be tracked over time.
Breaking LCP Down: The Four Subparts
A raw LCP value tells you that the page is slow, not why. Breaking the timeline into four subparts makes the cause much easier to locate.
Time to First Byte (TTFB)
TTFB covers the period from the start of navigation until the first byte of the HTML response arrives. It includes redirects, DNS lookup, connection setup, TLS negotiation, and the time the server spends producing the response.
TTFB is not a pure network-latency metric. A high value can come from geographic distance and slow connections, but it can equally come from slow application code, uncached database queries, or an overloaded origin. Separating DNS, connection, and TLS timings from server processing is the reliable way to distinguish these causes when the required timing data is available.
Resource load delay
This is the gap between TTFB and the moment the browser starts downloading the LCP resource. If the LCP element does not require a separate resource load to render, this subpart is zero.
For images, a long delay usually means the browser discovered the resource late. Common causes include an image referenced only in a CSS file, an image injected by JavaScript, or a loading="lazy" attribute on the hero image.
Resource load duration
This is the time spent downloading the LCP resource itself. Large, insufficiently compressed images, the absence of responsive image sizes, and slow delivery from a distant origin can all extend this phase.
Element render delay
This is the time between the resource finishing its download and the element actually appearing on screen. Render-blocking stylesheets and synchronous scripts, long main-thread tasks, web fonts that delay text rendering, and client-side frameworks that build the page in JavaScript can all hold rendering back even when the resource is already available.
Common Causes of Poor LCP
Most slow LCP values trace back to one or more of the following:
- Slow server response. An origin that takes a long time to generate HTML delays everything that follows.
- Late resource discovery. The browser cannot fetch an image it does not yet know about.
- Oversized images. Serving a 3000-pixel-wide JPEG to a mobile screen wastes bandwidth and time. See the Latixo guide on large images and website speed.
- Render-blocking resources. CSS and synchronous JavaScript in the
<head>can delay rendering. - Client-side rendering. When the main content is built by JavaScript, the LCP element cannot appear until the required scripts download, parse, and execute.
- Lazy-loading the hero image. Lazy loading is useful below the fold but counterproductive for the primary above-the-fold image.
How to Improve LCP
Start by identifying the LCP element and checking which subpart takes the most time. Optimizing image compression will do little if the real problem is a two-second server response.
If TTFB dominates, look at server-side caching, database query performance, and edge caching through a CDN. Check whether redirects add unnecessary round trips, and whether DNS, connection, or TLS timings are unusually high for users in particular regions.
If resource load delay dominates, make the LCP resource discoverable in the initial HTML. Use a standard <img> element with src or srcset rather than a CSS background where practical. For resources the browser cannot find early, consider <link rel="preload">. Setting fetchpriority="high" on the LCP image tells the browser to prioritize it over less important requests. Remove loading="lazy" from above-the-fold LCP images.
If resource load duration dominates, reduce the file size. Serve modern formats such as AVIF or WebP, provide responsive sizes with srcset and sizes, and compress appropriately. A well-configured CDN and effective cache headers can also reduce delivery time for many users.
If element render delay dominates, reduce render-blocking work. Inline critical CSS where appropriate, defer non-essential JavaScript, and break up long tasks on the main thread. If the LCP element is text, check how web fonts load and consider font-display settings that allow fallback text to render. For JavaScript-heavy sites, server-side rendering or static generation can make the main content available in the initial HTML.
Lab Data vs Field Data
LCP can be measured in two fundamentally different ways, and the results often differ.
Field data comes from real users visiting the page. The Chrome User Experience Report (CrUX), which feeds PageSpeed Insights and the Core Web Vitals report in Google Search Console, aggregates LCP values from eligible real Chrome visits. Field data reflects the actual mix of devices, networks, locations, and user behavior, and it is used for Core Web Vitals assessment. Its limitation is diagnostic depth: it describes distributions across real visits rather than the full timeline of one specific load.
Lab data comes from a controlled test run by a tool such as Lighthouse, Chrome DevTools, or a synthetic testing service. Because the conditions are controlled, lab tests are repeatable and can provide detailed timelines, request information, and rendering context. They are well suited to debugging and to verifying the effect of a change before it reaches real users.
Neither replaces the other. Field data shows whether a problem exists for real visitors; lab data helps explain why. A lab result can also differ from field data for legitimate reasons: the test location, device profile, network, cache state, and page state may not match what most real users experience.
Measuring LCP From Different Locations
Where a test runs has a direct effect on the timings that feed into LCP. DNS resolution, connection setup, and TLS negotiation involve network round trips, and each round trip can take longer as network distance and routing cost increase. A page that loads comfortably from a test machine near the origin may show a higher TTFB, and therefore a higher LCP, when loaded from another region.
Testing from multiple regions helps separate network effects from server and front-end problems. If LCP is slow across controlled tests from many regions, investigate server response and front-end loading behavior. If the slowdown is concentrated in certain regions, geographic distance, CDN coverage, DNS behavior, or regional third-party services may deserve closer inspection. A single test from one location is still a single sample and should not be treated as representative of every user in that region.
Using Latixo with LCP: Latixo V1.11.0 runs public pages in real Chromium from selectable Browser Nodes with Desktop and simulated Mobile profiles. The current Website Speed Test reports measurements such as TTFB, DOMContentLoaded, load time, page weight and request count, together with a final screenshot and Loading Replay. It does not currently report LCP or CLS directly. Use Latixo to inspect one controlled browser load and pair it with direct LCP data from tools such as Chrome DevTools, Lighthouse, PageSpeed Insights or CrUX.
Primary References
- web.dev — Largest Contentful Paint (LCP)
- web.dev — Optimize Largest Contentful Paint
- Google Search Central — Understanding Core Web Vitals and Google search results
For details about how Latixo performs a controlled browser test and how to interpret one run, see the Latixo testing methodology and the website speed test metrics guide.