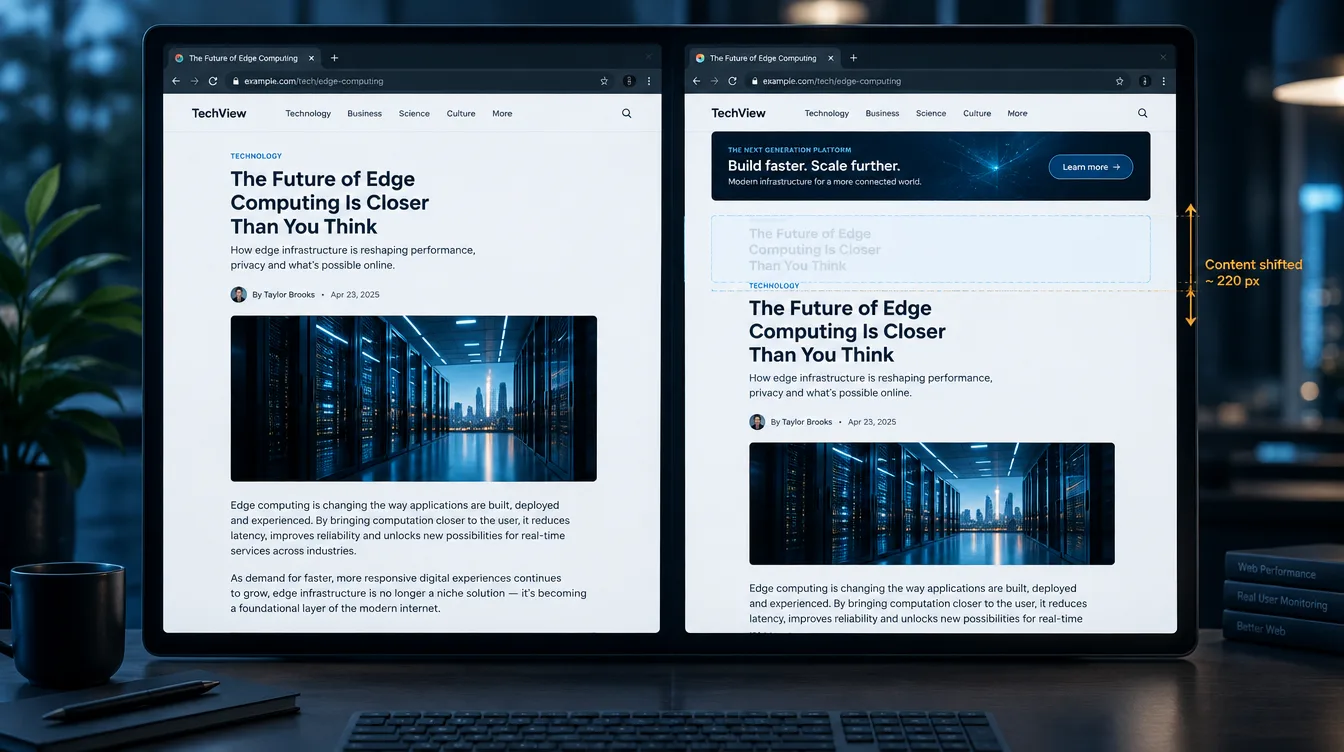
Cumulative Layout Shift (CLS) is a Core Web Vitals metric that measures how much visible content moves unexpectedly while a page is open. It produces a unitless score rather than a time. A score of 0.1 or lower is considered good, and anything above 0.25 is considered poor. The score is built from individual layout shifts, and each shift is weighted by how much of the viewport moved and how far it moved.
You have probably felt a bad CLS score before you ever saw one: you start reading a paragraph, an ad loads above it, and the text drops out of view. Or you reach for a button and tap something else because the page moved under your finger. CLS turns that experience into a number.
What counts as a layout shift
A layout shift happens when an element that is already visible in the viewport changes its starting position between two rendered frames. The browser calls these elements unstable elements. If a heading sits at 200 pixels from the top in one frame and at 300 pixels in the next, that heading has shifted.
Several things that look like movement do not count:
- Adding a new element. Inserting a banner is not itself a shift. The shift comes from the existing content it pushes down.
- An element changing size without moving others. A box that grows downward into empty space does not create a shift, but a box that grows and pushes the next section down does.
- CSS transforms. Animating with
transform: translate()orscale()does not trigger layout shifts, because it does not change the element’s layout position. - Shifts right after user input. Movement within 500 milliseconds of a discrete action such as a tap, click or key press is excluded, because the user caused it and expects it. Opening an accordion is fine. Scrolling, dragging and pinch-zoom are not counted as input for this rule.
That last exclusion matters in practice. A layout shift is not a problem simply because something moves. It is a problem when the user did not ask for the movement.
How the CLS score is calculated
Each individual shift receives a score:
layout shift score = impact fraction × distance fraction
- Impact fraction is the combined visible area that unstable elements occupied in the previous frame and the current frame, divided by the viewport area.
- Distance fraction is the largest distance any unstable element moved, horizontally or vertically, divided by the viewport’s larger dimension.
A worked example
Take a phone viewport of 390 × 844 CSS pixels. A text block 390 pixels wide occupies the area from 200 to 600 pixels down the screen. A 100-pixel promotional bar then loads above it and pushes the block down to 300–700 pixels.
- The union of the old and new positions covers 200–700 pixels, so it is 390 × 500 = 195,000 px².
- Impact fraction: 195,000 ÷ (390 × 844) ≈ 0.59
- Distance fraction: 100 ÷ 844 ≈ 0.12
- Layout shift score: 0.59 × 0.12 ≈ 0.07
One late-arriving bar uses most of the 0.1 budget. If a web font swap shifts the same block by another few pixels a moment later, the page can cross into “needs improvement” without any single dramatic change.
Session windows: why “cumulative” does not mean “everything added up”
CLS originally summed every shift across the page’s lifetime, which penalized long-lived pages such as single-page apps and infinite feeds. The current definition groups shifts into session windows. A window is a burst of shifts with less than one second between them, capped at five seconds in total. The page’s CLS is the score of its worst single window, not the total of all windows.
So a page with three separate, minor bursts spread across a long reading session is judged on its worst burst. A page that shifts repeatedly during the first two seconds of loading is judged on that whole cluster.
Good, needs improvement and poor
| CLS score | Rating |
|---|---|
| 0.1 or less | Good |
| Above 0.1 and up to 0.25 | Needs improvement |
| Above 0.25 | Poor |
For Core Web Vitals assessment, these thresholds are applied at the 75th percentile of real page loads, split by mobile and desktop. A page passes CLS when at least three out of four visits score 0.1 or better. A single excellent lab run says very little about whether that condition is met.
Where layout shifts usually come from
Images, video and iframes without reserved space
When the browser does not know an image’s dimensions before the file arrives, it lays out the page as if the image had zero height and then reflows everything below it when the image loads. Setting width and height attributes, or a CSS aspect-ratio, lets the browser reserve the box early. The same applies to video posters and embedded iframes. The guide to large images and website speed covers this alongside the weight and LCP side of image performance.
A subtler version shows up with responsive images. If the aspect ratio changes at a breakpoint but the reserved ratio does not, the shift appears only on certain screen sizes.
Ads, embeds and other late-injected content
Ad slots that collapse when empty, expand when filled, or resize to fit a different creative are a common source of high CLS. Consent banners, newsletter bars and “recommended for you” widgets cause the same problem when they are inserted into the document flow above existing content instead of being placed as overlays. Reserving a fixed or minimum height for the slot is usually more effective than optimizing the script that fills it.
Web fonts
When a fallback font is swapped for a web font, text with different metrics can rewrap. Lines get longer or shorter, and everything below them moves. Preloading key fonts reduces the window in which this can happen. Matching fallback metrics with descriptors such as size-adjust, ascent-override and descent-override reduces how far text moves when the swap happens. font-display: optional avoids the swap on slow loads, but the first-time visitor may never see the web font.
Content that arrives after rendering
Client-rendered sections that fetch data and then insert results above content the user can already see will shift the page. Skeleton placeholders help only when their height roughly matches the final content. A 40-pixel skeleton replaced by a 300-pixel product grid still moves the page.
Animating layout properties
Animating top, left, height, width or margin changes layout on every frame and can register as a series of shifts. Moving the same animation to transform produces the same visual effect without layout shifts.
Lab CLS and field CLS often disagree
This is the most common source of confusion, and it is expected behavior rather than a measurement error.
A default Lighthouse audit or a load-only recording in the Chrome DevTools Performance panel observes shifts during page load in a controlled environment. It does not scroll, tap through menus or wait while a lazy-loaded ad slot fills halfway down an article.
Field data, such as the Chrome User Experience Report shown in PageSpeed Insights and the Core Web Vitals report in Google Search Console, covers the whole lifespan of real visits. It includes shifts that happen while users scroll, content that loads below the fold, and ads that refresh. Field CLS can therefore be noticeably higher than lab CLS on the same page.
A few other details affect field numbers:
- When a page is restored from the back/forward cache, its CLS starts again from zero, because the user experiences it as a new visit.
- Shifts inside iframes count toward the page’s CLS, even though the browser API on the parent page does not report them directly. This can make field data hard to match against a local trace.
- CrUX data comes from eligible Chrome users. The Layout Instability API that reports individual shifts has historically been available mainly in Chromium-based browsers, so in-house monitoring based on that API reflects only those visitors.
When lab CLS is low and field CLS is high, the likely explanation is shifts that occur after load. These often come from ads, infinite scroll, sticky elements or content that loads as the user scrolls.
How to find the elements causing shifts
- Start with field data in PageSpeed Insights or Search Console to confirm whether CLS is a real-user problem, and whether it affects mobile, desktop or both.
- Record a load in Chrome DevTools. The Performance panel shows layout shifts on the timeline and lists the elements that moved. The Rendering panel can also highlight shifted regions on screen.
- Interact like a user. Scroll, open menus and wait on ad-heavy pages while recording, because load-only traces miss post-load shifts.
- Log shifts in production. The
web-vitalsJavaScript library can report CLS together with the element that contributed most to it. That attribution is useful when a shift appears only on certain templates or devices. - Fix by reserving space first, then look at timing. Most CLS fixes involve declaring the space content will need before it arrives, rather than making it arrive faster.
Does CLS affect SEO?
Google has said that Core Web Vitals, including CLS, are used by its ranking systems as part of a broader page experience assessment. Good scores do not guarantee higher rankings, and relevance to the search query still matters far more. The practical case for fixing CLS is just as strong without the ranking argument: unstable layouts cause misclicks, interrupt reading and can trigger accidental ad clicks or purchases, and users tend to remember those problems.
What Latixo shows, and what it does not
Latixo loads a page in a real Chromium browser from a selected test location and reports results such as TTFB, total load time, page weight and request count, along with a final screenshot and a Loading Replay. It does not currently report a CLS score. The Website Speed Test Metrics page lists exactly which fields are included.
Latixo can still help as a visual check. The Loading Replay shows the browser’s view as the page loads, so a banner pushing content down, an image snapping into place, or a font swap that rewraps a heading can be visible in the recording. The mobile test profile uses a 390 × 844 viewport with throttled CPU and network, which can make late-arriving content easier to notice. Seeing a jump in the replay tells you that something moved. It does not tell you how much the movement would score. To get a CLS number and identify the elements responsible, use DevTools, Lighthouse or PageSpeed Insights.
For the loading side of Core Web Vitals, see the Largest Contentful Paint guide. LCP and CLS share several causes, especially images without declared dimensions. To run a load from a specific region, start a test from the Latixo homepage.
Primary References
- web.dev — Cumulative Layout Shift (CLS)
- web.dev — Optimize Cumulative Layout Shift
- Google Search Central — Understanding page experience in Google Search results
For details about the test data Latixo currently reports, see the Website Speed Test Metrics page and testing methodology.