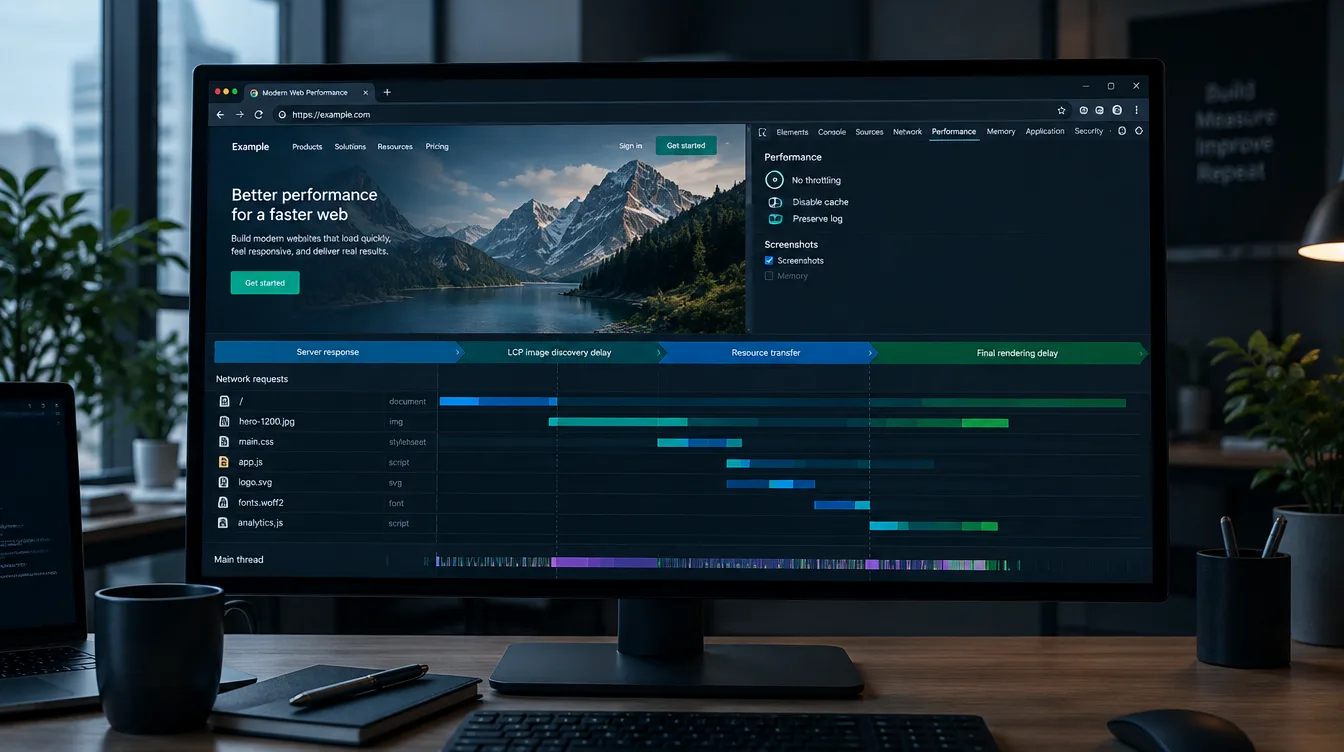
To improve Largest Contentful Paint, first find out where the time goes, then fix that part. Every LCP value splits into four phases: server response (TTFB), the delay before the browser starts fetching the LCP resource, the download itself, and the wait between download and paint. Most slow LCP scores are dominated by one or two of these phases. Work on the wrong one and you can spend a week optimizing without moving the number. Compressing a hero image that already downloads in 200 ms will not fix a 4-second LCP if the first 1.8 seconds go to waiting on the server.
This guide covers fixes for each phase. For what LCP measures, which elements qualify and how the thresholds work, see the Latixo guide to Largest Contentful Paint.
Start with the breakdown, not the fixes
Before changing anything, get the LCP element and its phase breakdown for the page and device type that is failing.
| Phase | What it covers | Rough healthy share of LCP |
|---|---|---|
| Time to First Byte | Navigation start to the first byte of HTML: redirects, DNS, connection, TLS, server work | ~40% |
| Resource load delay | TTFB to the moment the LCP resource request starts | <10% |
| Resource load duration | Downloading the LCP resource | ~40% |
| Element render delay | Resource finished to element painted | <10% |
The percentages come from web.dev’s LCP optimization guidance. Google describes them as guidelines rather than strict targets. The useful part is the pattern: the two “delay” phases should be as small as practical, because long gaps there usually indicate avoidable waiting. A page where render delay takes 45% of LCP has a different problem from a page where TTFB takes 70%, even if both report 3.8 seconds.
Current versions of Chrome DevTools (Performance panel) and Lighthouse show this breakdown for a lab load. For real-user data, the attribution build of Google’s web-vitals JavaScript library reports the same four phases from actual visits. That matters, because lab and field breakdowns often disagree.
Check mobile and desktop separately. The LCP element is frequently different between the two: a hero image on desktop may become a headline on a narrow screen, or the reverse. A fix aimed at the desktop LCP element will not help a mobile score driven by something else.
If the LCP element is text rendered without a separate LCP resource, resource load delay and load duration are zero. Focus on TTFB and render delay, including any web font that may be preventing the text from appearing.
Fix TTFB when the server holds the time
A high TTFB delays everything after it. Front-end optimization can sometimes overlap later work, but it cannot erase the time already spent waiting for the document. When TTFB takes more than about half of LCP, start here.
Remove redirect hops. Chains such as http:// → https:// → www. → trailing slash each add at least one round trip before the real HTML request begins. Link directly to the final URL in navigation, ads, emails and canonical tags. Configure the server to go to the final destination in one hop where a redirect is unavoidable.
Cache HTML, not only static files. Many sites put images, CSS and JavaScript on a CDN while every HTML request still goes back to the origin and runs the full application. For pages that look the same to every anonymous visitor, full-page caching at the server or the CDN edge usually has the largest single effect on TTFB. Check for cache misses caused by cookies or query strings. Marketing parameters such as utm_source can create a separate cache entry for every campaign link unless the cache key ignores them.
Find the slow part of page generation. If caching is not possible (logged-in pages, carts, heavily personalized content), profile what the application does per request. Uncached database queries, synchronous calls to external APIs and plugin-heavy CMS installs are common causes. Fragment caching or moving personalization to a client-side request after the main content renders can help on pages that cannot be cached whole.
Check whether the problem is regional. TTFB includes network round trips, so the same server can return a fast TTFB to a nearby test location and a slow one to a distant one. If TTFB is high only from certain regions, the fix is more likely CDN coverage, edge caching or origin placement than application code. The guide on why website speed varies by location covers how to read these differences without overinterpreting them.
Consider 103 Early Hints where supported. If the server needs time to generate HTML, an Early Hints response can tell the browser to preconnect to required origins or preload the LCP image while it waits. This does not lower TTFB itself. It lets other work overlap with it, which shortens resource load delay. Support depends on the server and CDN, and the hints only help when they point to resources the page actually uses.
What counts as a reasonable TTFB depends on the page type and the audience’s location. The guide What Is a Good TTFB? covers benchmarks and how to interpret them.
Make the LCP image discoverable early
Resource load delay is the gap between the first byte of HTML arriving and the LCP image request starting. A large gap often means the browser found the image late, or discovered it early but did not start the request promptly.
The browser’s preload scanner reads raw HTML ahead of the parser and starts fetching resources it can see. Anything it cannot see waits. These patterns hide the LCP image from it:
- The hero is a CSS background image. The browser must download and parse the stylesheet, then match the rule to an element, before requesting the image.
- The image is inserted by JavaScript. Sliders, carousels and component frameworks often add the image only after a script runs.
- A lazy-loading library swaps
data-srcfor src. The real URL is invisible until the script executes. - The image has
loading="lazy". Native lazy loading waits until layout confirms the image is in the viewport. That is the right behavior for images below the fold and the wrong one for the LCP image. Some CMS themes and plugins addloading="lazy"to every image by default, so check the rendered HTML, not just the template.
Where possible, the fix is a plain <img> element in the initial HTML with src or srcset, no lazy loading, and fetchpriority="high". That attribute signals a high fetch priority early. Reserve it for the actual LCP image, rather than marking many competing images as high priority.
When the design genuinely needs a CSS background or a script-rendered image, add <link rel="preload" as="image" fetchpriority="high"> in the <head>. For responsive images, include imagesrcset and imagesizes so the browser preloads the same variant it will display. A preload that fetches the desktop hero on a phone wastes bandwidth and competes with the image the page actually uses.
If the LCP image is served from a separate origin, the browser may need a new DNS lookup, connection and TLS handshake before the download can start. A <link rel="preconnect"> to that origin can reduce the startup cost. Serving the image from the HTML origin can avoid that separate browser connection, but changing origins or proxying an image CDN should be measured because it can introduce other delivery tradeoffs.
Reduce the image download time
Once the request starts on time, resource load duration depends on transferred bytes, network conditions and delivery distance.
- Serve the size the screen needs. A 2400-pixel image displayed at 400 CSS pixels wide transfers far more data than the page uses.
srcsetwith accurate sizes lets the browser choose a suitable file. Inaccurate sizes values are a common reason responsive images still download too large. - Use modern formats. AVIF and WebP generally produce smaller files than JPEG at similar visual quality. The exact saving varies by image content, so compare results on your own images.
- Tune compression. A hero photo saved at maximum quality is often much larger than one at a moderate setting that looks the same on screen.
- Shorten the distance. A CDN or image CDN reduces network travel time for distant visitors and often handles format conversion and resizing.
- Watch for competition. The LCP image shares bandwidth with fonts, stylesheets, scripts and other images loading at the same time. On a constrained mobile connection, a dozen high-priority requests can slow the one that matters. Lowering the priority of off-screen images, such as hidden carousel slides, frees capacity.
Browser HTTP caching makes repeat visits faster but cannot help a first-time browser request without a cached copy. A CDN’s shared edge cache can still help a first-time visitor. Cache headers matter, but they cannot replace a smaller file. The guide on how large images slow down a website covers image weight in more depth.
Fix render delay after the resource arrives
Element render delay is the time an image sits downloaded but not painted, or, for text LCP without a separate resource, the time from TTFB until the text is painted. It is often overlooked because the network waterfall looks fine.
Render-blocking CSS. The browser normally waits for render-blocking stylesheets in the <head> before painting. A large CSS bundle, or several blocking stylesheets from different origins, can hold the LCP element back even when its image has already arrived. Inlining the small amount of CSS needed for above-the-fold content and loading non-critical styles separately can reduce this. Removing unused CSS helps too, but needs testing, because tools that detect unused CSS can miss styles applied later by JavaScript.
Synchronous JavaScript and long tasks. Scripts in the <head> without defer or async block parsing. Large scripts that run on the main thread can delay painting even after parsing finishes, because rendering happens on the same thread. Deferring non-essential scripts and splitting long tasks both help.
A/B testing and anti-flicker snippets. Some experimentation tools hide the page, or part of it, until the experiment script loads and decides what to show. The LCP element cannot paint while hidden. If a testing snippet sets the page to invisible with a timeout, that timeout can show up directly in your LCP. Server-side experiments avoid the problem; limiting the hidden area to the elements under test reduces it.
Client-side rendering. On a single-page application that ships an almost empty HTML shell, the main content appears only after JavaScript downloads, executes and often fetches data from an API. A large gap between TTFB and the first paint points in this direction. Server-side rendering, static generation or prerendering put the main content into the initial HTML.
Web fonts on text LCP. If a headline is the LCP element and its font uses font-display: block (or the browser default), the text can stay invisible while the font downloads. font-display: swap or optional lets fallback text render first. Swap may cause a visible font change and a small layout shift, so check CLS after the change.
Entrance animations. Elements that start hidden and fade or slide in can register a later LCP than the moment their content was ready. Keep the main content visible from the first frame if LCP is a priority.
Edge cases where standard advice misleads
The LCP element is not the one you optimized. Cookie consent banners, newsletter pop-ups and chat widgets can sometimes become the largest eligible visible element on mobile, especially when they are injected by JavaScript after everything else. If the breakdown identifies one of these, optimizing the hero image will not change the reported LCP.
Lab is fast, field is slow. A lab test runs one device profile from one location with defined cache conditions. Field data at the 75th percentile includes slower phones, weaker networks, distant visitors and returning users with different cache states. A clean lab result does not prove the field problem is solved, and a slow field value does not always reproduce in a single lab run. Third-party scripts that behave differently by region or consent state widen the gap further.
The element changes between visits. Rotating heroes, personalized banners and geo-targeted content can produce a different LCP element for different visitors. Field data then mixes several elements into one distribution.
Single-page app route changes. Standard LCP measurement in Chrome covers full page loads. Client-side route changes in a single-page application are not reported as separate LCP values in the Chrome User Experience Report, so improvements to in-app navigation will not show up there.
Back/forward cache and prerendering. Pages restored from the back/forward cache or loaded through prerendering can report very low LCP values. These can make field distributions look better than a typical first visit.
Verify the change before declaring it fixed
- Record a baseline. Run several lab tests from the same location and device profile, and note the LCP element and the four phases, not just the total.
- Change one thing at a time. If you add fetchpriority, remove lazy loading and resize the image in one deployment, you will not know which change mattered, or whether one of them made things worse.
- Compare the breakdown. A fix for resource load delay should shrink that phase. If the total improved but a different phase grew, something else changed.
- Repeat the runs. Single lab results vary between runs because of network conditions, cache state and third-party behavior. A difference smaller than the normal spread between repeated runs is not strong evidence.
- Wait for field data. The Chrome User Experience Report data behind PageSpeed Insights and Search Console uses a rolling 28-day window, so a deployed fix takes weeks to show fully in field results.
Using Latixo while you work on LCP
Latixo V1.11.0 runs a page in real Chromium from eight LIVE Browser Node locations: Virginia, Seattle, Nuremberg, Tokyo, Singapore, São Paulo, Beijing and Sydney. It offers both Desktop and simulated Mobile test profiles. The Website Speed Test reports TTFB, total load time, page weight, request count, HTTP status, negotiated protocol and content type, along with a final screenshot and a Loading Replay of the page load.
Latixo does not currently report LCP or its phase breakdown as a result field. For the LCP value itself, use Chrome DevTools, Lighthouse, PageSpeed Insights or web-vitals field data. Latixo is useful alongside those tools in a few specific ways:
- Checking whether TTFB is regional. Running the same URL from several nodes shows whether the first phase of LCP is slow everywhere or only from certain locations. That helps separate origin problems from CDN coverage or routing problems.
- Watching when the main content appears. The Loading Replay shows the page as it loaded in that run, including whether the hero area stays empty while other content renders. This is a visual observation, not an LCP measurement, but it often makes a late-loading hero image or a hidden-then-revealed page obvious.
- Checking page weight after an image fix. Page weight and request count before and after a change show whether the new images and formats reduced transfer as expected.
- Shopify storefronts. The Shopify Speed Test lists the largest and slowest resources observed in one measured storefront load, which helps when a theme or app adds the oversized hero image or a heavy script.
Each Latixo result is one controlled run. For how to read that kind of result, see the Latixo testing methodology and the website speed test metrics guide.